
| 일 | 월 | 화 | 수 | 목 | 금 | 토 |
|---|---|---|---|---|---|---|
| 1 | 2 | 3 | 4 | 5 | 6 | 7 |
| 8 | 9 | 10 | 11 | 12 | 13 | 14 |
| 15 | 16 | 17 | 18 | 19 | 20 | 21 |
| 22 | 23 | 24 | 25 | 26 | 27 | 28 |
- kafka #mirrormaker consumer lag
- kafka #streamdata-processing #kafka-consumer
- kafka #streamdata-processing #mirrormaker
- Kibana
- Apache Druid #Apache Kafka #Apache Pinot #Real streaming
- Today
- Total
더비창고방
MirrorMaker consumer lag 모니터링 본문
목차
- Consumer lag 이란?
- MirrorMaker Consumer lag 모니터링 프로그램 설명
- Lag_monitor.py 설명
- [번외] AWS cloudwatch 로 consumer lag 모니터링
1. Consumer lag 이란?
Kafka 의 producer가 보낸 메세지의 offset과 consumer가 받은 메세지의 offset 차이로, consumer의 상태 모니터링에 사용하는 지표 중 하나이다.
2. MirrorMaker Consumer lag 모니터링 프로그램 설명
MirrorMaker 구동시 제대로 작동하는지 모니터링하기 위해 consumer lag을 출력하는 쉘스크립트를 작성했었다.
하지만, 연동하는 토픽이 많을수록 스크립트 실행 창을 여러개 띄워야해서 한곳에 모아 모니터링 하는 방법을 고민했었다.
Consumer lag 모니터링의 주 목적은 다음과 같다.
- 연동하는 토픽 별 MirrorMaker Consumer lag 모니터링을 한 곳에 할 수 있다.
- Kibana 대시보드를 이용해 Consumer lag의 상태를 차트로 볼 수 있다.
모니터링 프로그램 구성
미러링하는 인스턴스의 consumer lag 정보를 Lag_monitor.py (모니터링을 위해 별도로 작성한 프로그램)을 통해 Elasticsearch로 보내고, Kibana 대시보드를 이용해 모니터링 한다.
3. Lag_monitor.py 설명

Lag_monitor.py의 메인함수 프로세스는 3단계이다.
- Elasticsearch 연결
- Elasticsearch Index 생성
- 파이프라인 함수 실행
여기서, 파이프라인 함수는 연동중인 토픽 별로 thread 실행을 한다.

Lag_monitor.py의 Pipeline 함수 프로세스는 4단계이다.
- Consumer Lag 출력하는 command line 명령어 생성 함수를 실행
- mirrormaker instance에 SSH 원격접속
-
- 에서 생성한 Consumer Lag을 출력하는 command line 명령어 실행
- Consumer Lag 출력결과를 elasticsearch로 전송
Lag_monitor.py 소스코드 설명
- 모듈 import Lag_monitor.py를 실행하기 위한 모듈을 불러온다.
import time
from datetime import datetime
import json
import threading
import paramiko
from elasticsearch import Elasticsearch
1. Elasticsearch 연결
Elasticsearch 모듈을 이용해 oasis-elasticsearch 서버와 연결을 한다.
## connect elasticsearch
es = Elasticsearch(['<http://es-node1-ip:9200>','<http://es-node2-ip:9200>','<http://es-node3-ip:9200>'],
					basic_auth=('ID','PW'))
2. Elasticsearch Index 생성
Consumer lag 정보를 저장할 index를 생성한다.
## create index
if es.indices.exists(index='consumer_lag') :
        pass
else :
   with open('mapping.json', 'r') as f :
        mapping = json.load(f)
   es.indices.create (index='consumer_lag', body=mapping)
index명은 consumer_lag으로 지정하였고, 만약 ‘consumer_lag’ index가 존재하면 index 생성과정을 넘긴다.
‘consumer_lag’ index의 schema 정보를 mapping.json 파일에 작성하였고, index 생성시 mapping.json 파일을 읽어 index의 schema 정보를 지정한다.
** mapping.json
{
    "mappings":{
        "properties":{
            "@timestamp":{"type" : "date"},
						"topic":{"type" : "text"},
						"p0":{"type" : "integer"},
						"p1":{"type" : "integer"},
						"p2":{"type" : "integer"},
						"p3":{"type" : "integer"},
						"p4":{"type" : "integer"},
						"p5":{"type" : "integer"},
						"p6":{"type" : "integer"},
						"p7":{"type" : "integer"},
						"p8":{"type" : "integer"},
						"p9":{"type" : "integer"},
						"p10":{"type" : "integer"},
						"p11":{"type" : "integer"},
						"p12":{"type" : "integer"},
						"p13":{"type" : "integer"},
						"p14":{"type" : "integer"},
						"p15":{"type" : "integer"},
						"p16":{"type" : "integer"},
						"p17":{"type" : "integer"}
        }
    }
}
3. 파이프라인 함수 실행
파이프 라인 함수
def lag_pipeline(ssh_key,es_conn,hostname,topic_name,monitor_cli,run_event):
    # SSH client 연결
		client = paramiko.SSHClient()
    client.set_missing_host_key_policy(paramiko.AutoAddPolicy())
    client.connect( hostname=hostname, username='ec2-user', pkey=ssh_key )
	  # SSH 연결 후 consumer lag 지표 출력 shell script 명령어 실행에 따른 결과를 가져옴
		stdin, stdout, stderr = client.exec_command(monitor_cli)

		while True:
        line = stdout.readline()
        if not line:
            break
				# consumer lag 지표를 받아, 전처리 후 elasticsearch로 보냄
        info = [datetime.utcnow().strftime('%Y-%m-%dT%H:%M:%S.%f')[:-3]+'Z',topic_name]
        lag = line.split('\\n')[0].split(' ')
        dict1 = dict(zip(['@timestamp','topic'], info))
        dict2 = {'p'+str(i) : lag[i] for i in range(len(lag))}
        document = dict(dict1, **dict2)
        es_conn.index(index='consumer_lag', body= document)
# Input parameter 설명
ssh_key : mirrormaker instance ssh 접속에 필요한 key (ec2 pem file을 RSA key로 변환한 값)
es_conn : consumer lag의 값을 elasticsearch로 보내기 위해 elasticsearch와 연결한 client
hostname : mirrormaker instance ip 주소
topic_name : consumer lag 지표를 수집하는 대상 토픽 명
monitor_cli : consumer lag 지표를 출력하는 shell script 명령어
consumer lag 지표 출력하는 shell script 명령어 생성 함수
def lag_export_cli(source_bootstrap_server, mm_consumer_properties_file_nm, topic):
    cli_1 = "while sleep 1;
			do echo -e $(/home/ec2-user/kafka_2.12-2.6.2/bin/kafka-consumer-groups.sh
			--bootstrap-server "
    cli_2 = " --group consumer group --describe
			  --command-config /home/ec2-user/kafka_2.12-2.6.2/config/"
    cli_3 = " --describe 2> /dev/null | grep "
    cli_4 = " | sed 's/\\s\\+/\\\\t/g' | cut -f 6 | xargs); done"
    cli = cli_1+str(source_bootstrap_server)+cli_2
					+str(mm_consumer_properties_file_nm)+cli_3+str(topic)+cli_4
    return cli
# Input parameter 설명
source_bootstrap_server : 토픽 연동하는 source kafka의 bootstrap server 주소 값
mm_consumer_properties_file_nm : mirrormaker에서 사용하는 consumer properties 파일명
topic : 미러링 대상 토픽명
메인함수 내 파이프라인 함수 실행
# 1. ec2 ssh 접속을 위한 key 생성
key_path = 'ec2 pemfile path'
ssh_key = paramiko.RSAKey.from_private_key_file(key_path)

# 2. lag 추출 cli 명령어 생성
t1_cli = lag_export_cli(source_bootstrap_server="source kafka bootstrap server",
					mm_consumer_properties_file_nm="mirrormaker consumer properties file name",
					topic="topic name"

# 3. pipeline 함수 thread 실행
t1 = threading.Tread(target=lag_pipeline,
					args=(ssh_key, es, 'ec2 mirrormaker ip', 'topic name', t1_cli)

t1.start()
미러링 대상 토픽별로 source kafka bootstrap, topic 명, mirrormaker 인스턴스 ip주소, mirrormaker consumer properties 파일명을 수정하여 pipeline 함수 thread를 생성한다.
1. ec2 ssh 접속을 위한 key 생성
ssh_key 변수에 ec2 접속을 위한 pem file을 이용해 RSA key로 변환한 값을 할당한다.
2. lag_export_cli 함수 실행
인자값으로 source kafka bootstrap_server 주소, mirror maker consumer properties file 명, 토픽 명을 입력하여
consumer lag 추출하는 command line 명령어를 생성후 t1_cli 변수에 할당한다.
3. 파이프라인 함수를 thread로 실행
threading 모듈의 thread 함수를 사용하며,인자값으로는 target 과 args 가 있다.
targetthread 실행할 함수명 즉, lag_pipeline을 입력한다argslag_pipeline 함수의 인자값 (ssh_key , es_conn , hostname , topic_name , monitor_cli )
을 차례대로 입력한다.
[번외] AWS cloudwatch 로 consumer lag 모니터링
프로젝트 수행시 위와 같은 방법으로 consumer lag 모니터링을 했으나, role off 후 cloudwatch에 custom metric을 보낼 수 있다는 것을 알게되었다.
그래서 Toy project로 MirrorMaker의 consumer lag을 AWS cloudwatch에 custom metric으로 보내는 쉘스크립트를 작성하여 실습해보았다.
Architecture

AWS CLI Cloudwatch 서비스의 put-metric-data 명령어를 활용해
mirrormaker의 consumer lag 지표를 AWS CLoudwatch 에 custom metric으로 보내는 구조이다.
consumer-lag_to_cloudwatch.sh
while true; do
lag=$(/home/ec2-user/kafka_2.12-2.6.2/bin/kafka-consumer-groups.sh \\
		--bootstrap-server {source kafka bootstrap server} \\
		--group {mirrormaker consumer group} \\
		--describe \\
		--command-config /home/ec2-user/kafka_2.12-2.6.2/config/{mirrormaker consumer properties} \\
		--describe 2> /dev/null | grep test | sed 's/\\s\\+/\\t/g' | cut -f 6 | xargs)
aws cloudwatch put-metric-data \\
--namespace {custom metric namespace}
--metric-name {custom metric name}
--value $lag
echo -e -n "$(date)\\t"
echo -e -n "topic: {topicname}\\t"
echo -e -n "consumer-lag\\t"
echo -e $lag
sleep 1
done
파티션별 consumer lag 값을 가져오는 것은 따로 --dimesion이라는 속성값으로 구분을 해야할거같음?? (관련해서는 더 찾아봐야함)
consumer-lag_to_cloudwatch.sh 실행 화면
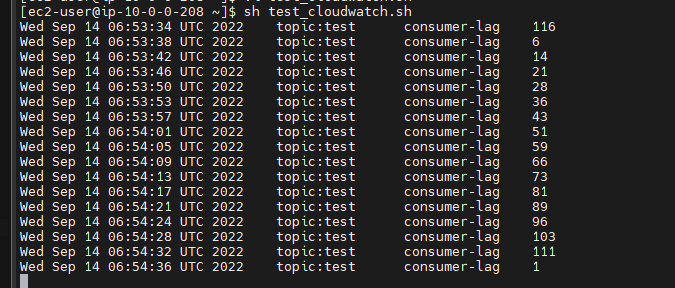
앞의 쉘스크립트를 실행하면 해당 토픽의 consumer lag의 값이 콘솔창에 출력이 된다.
Cloudwatch에서 custom metric 대시보드 화면

Custom mertric으로 받은 MirrorMaker consumer lag 의 값을 그림과 같이 cloudwatch 대시보드에서 확인 가능하다.
'STUDY' 카테고리의 다른 글
| Apache Druid 를 활용한 실시간 데이터 처리 파이프 라인 구축 실습 (0) | 2023.01.18 |
|---|---|
| elasticsearch-kibana 사용자 인증 및 관리 (0) | 2022.12.20 |
| Kibana 설치하기 (1) | 2022.12.20 |
| MirrorMaker 연동/기동 방법 (0) | 2022.12.20 |
| kafka-consumer (0) | 2022.12.20 |


